Markets📉

Let's take a look at where the markets are:
S&P 500:

The SP500 is now down at November 24, 2020 levels, down over 25% which confirms a bear market for the index. It took 400 days for the index to reach its all-time high from November 24, 2020, to January 04, 2022, but the decline only took 280 days back to the same level it's currently at.
NASDAQ:
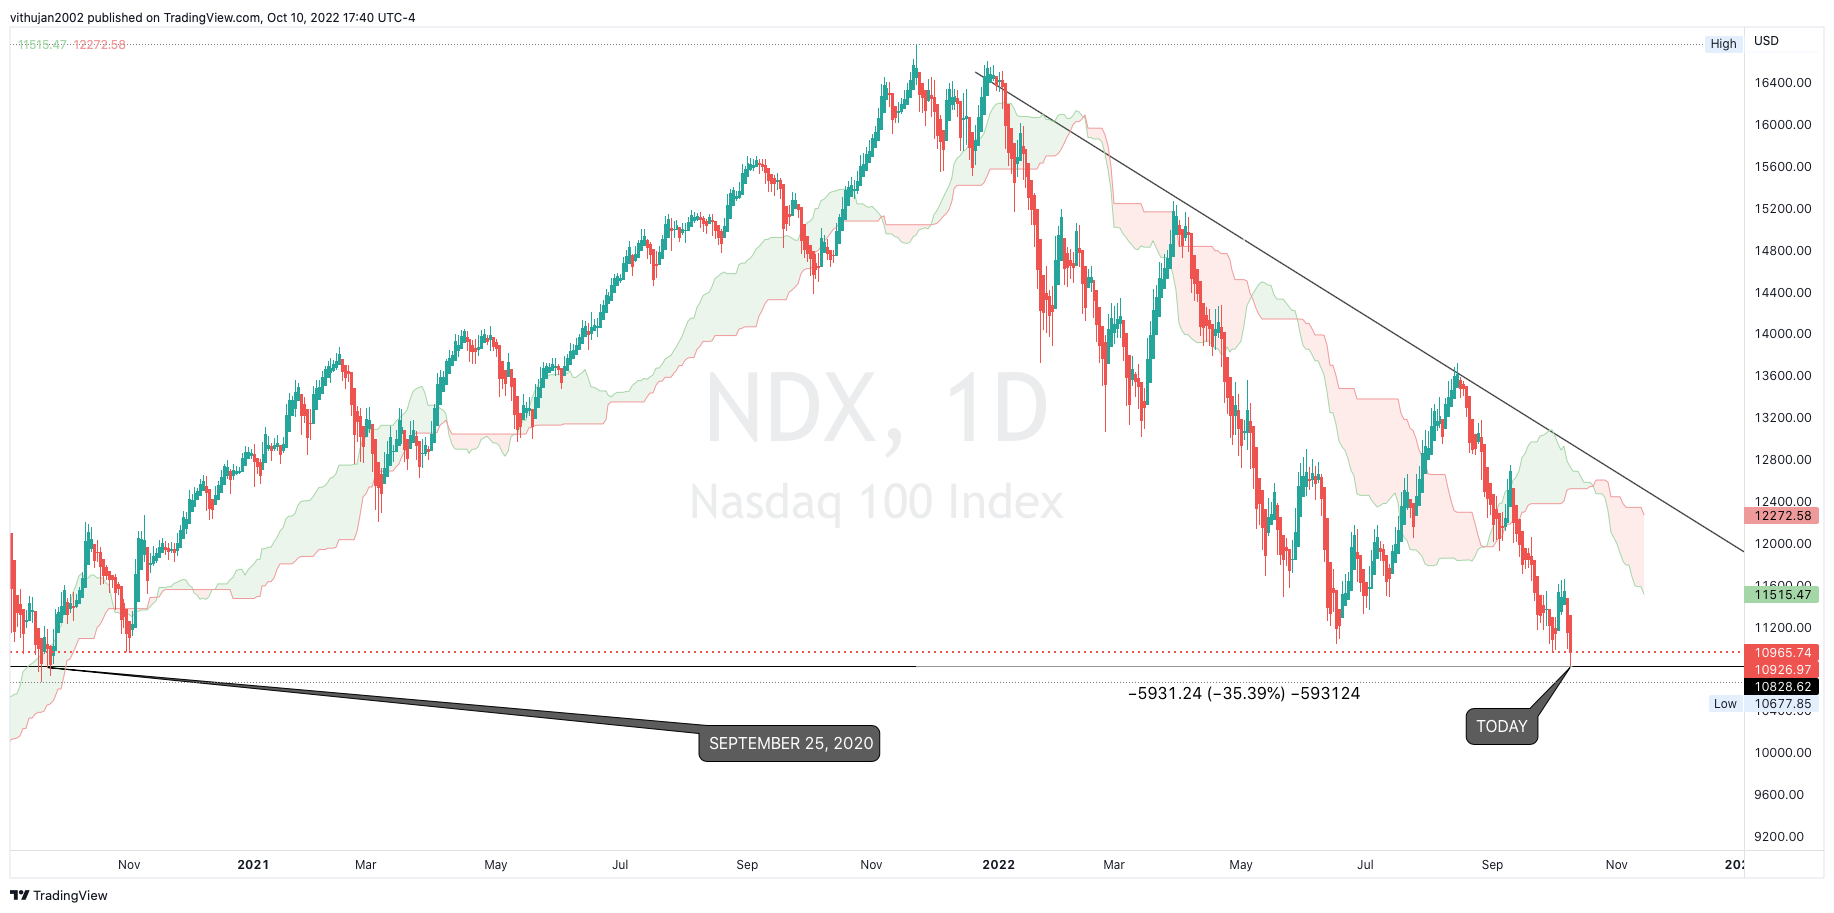
The NDX today just broke a record low not seen in 2 years! Down over 35% back down to September 25, 2020 levels at 10,828. The sell-off was highly correlated with the index's heavy exposure to tech-based stocks which are seen as the more risky stocks and in a broad-based market sell-off, they will bleed the fastest and hardest.
DOW JONES:
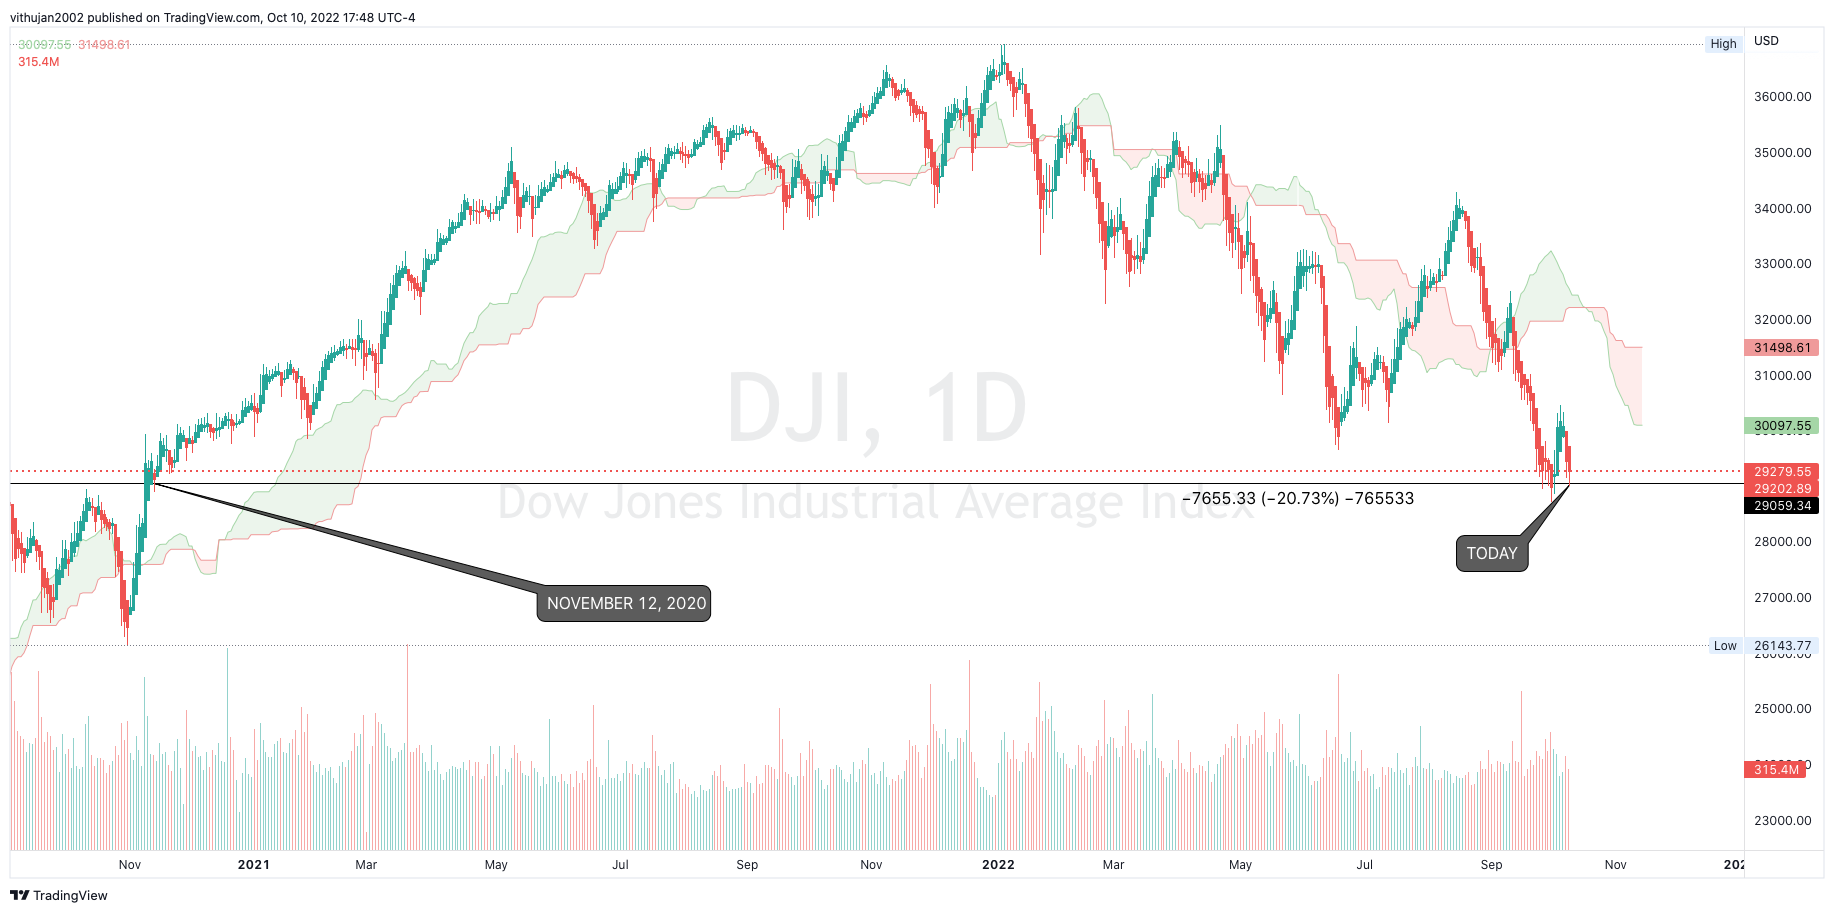
The Dow Jones is now at a November 12, 2020 level, down over 20% and except for the sell-off that happened in 2020 due to COVID lockdowns, the last time such a sell-off occurred was back during the 2008 financial crisis.
BITCOIN:
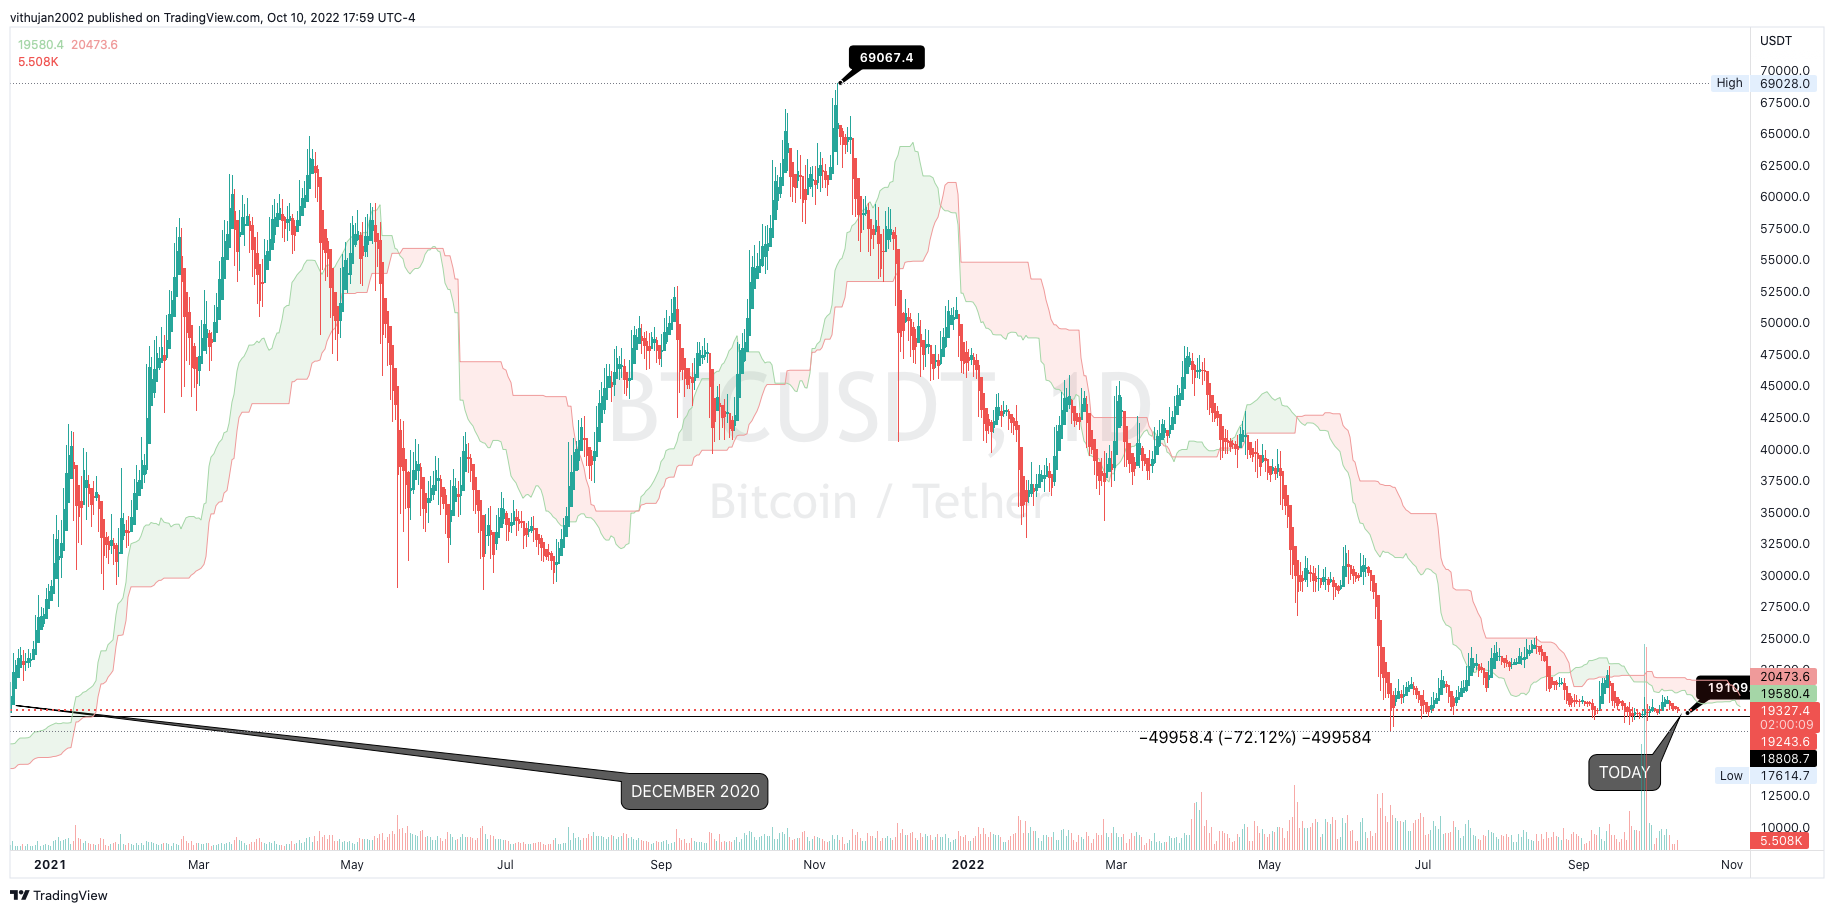
As I have posted many times during late 2021 and early 2022 that Bitcoin is heading for a bear market and visiting the previous bull market all-time high of $19,780, BTC is currently down over 70% since the start of the year now trading at $19,300 which is below 2017 ATH. More on-chain analysis coming for BTC soon.
DXY:
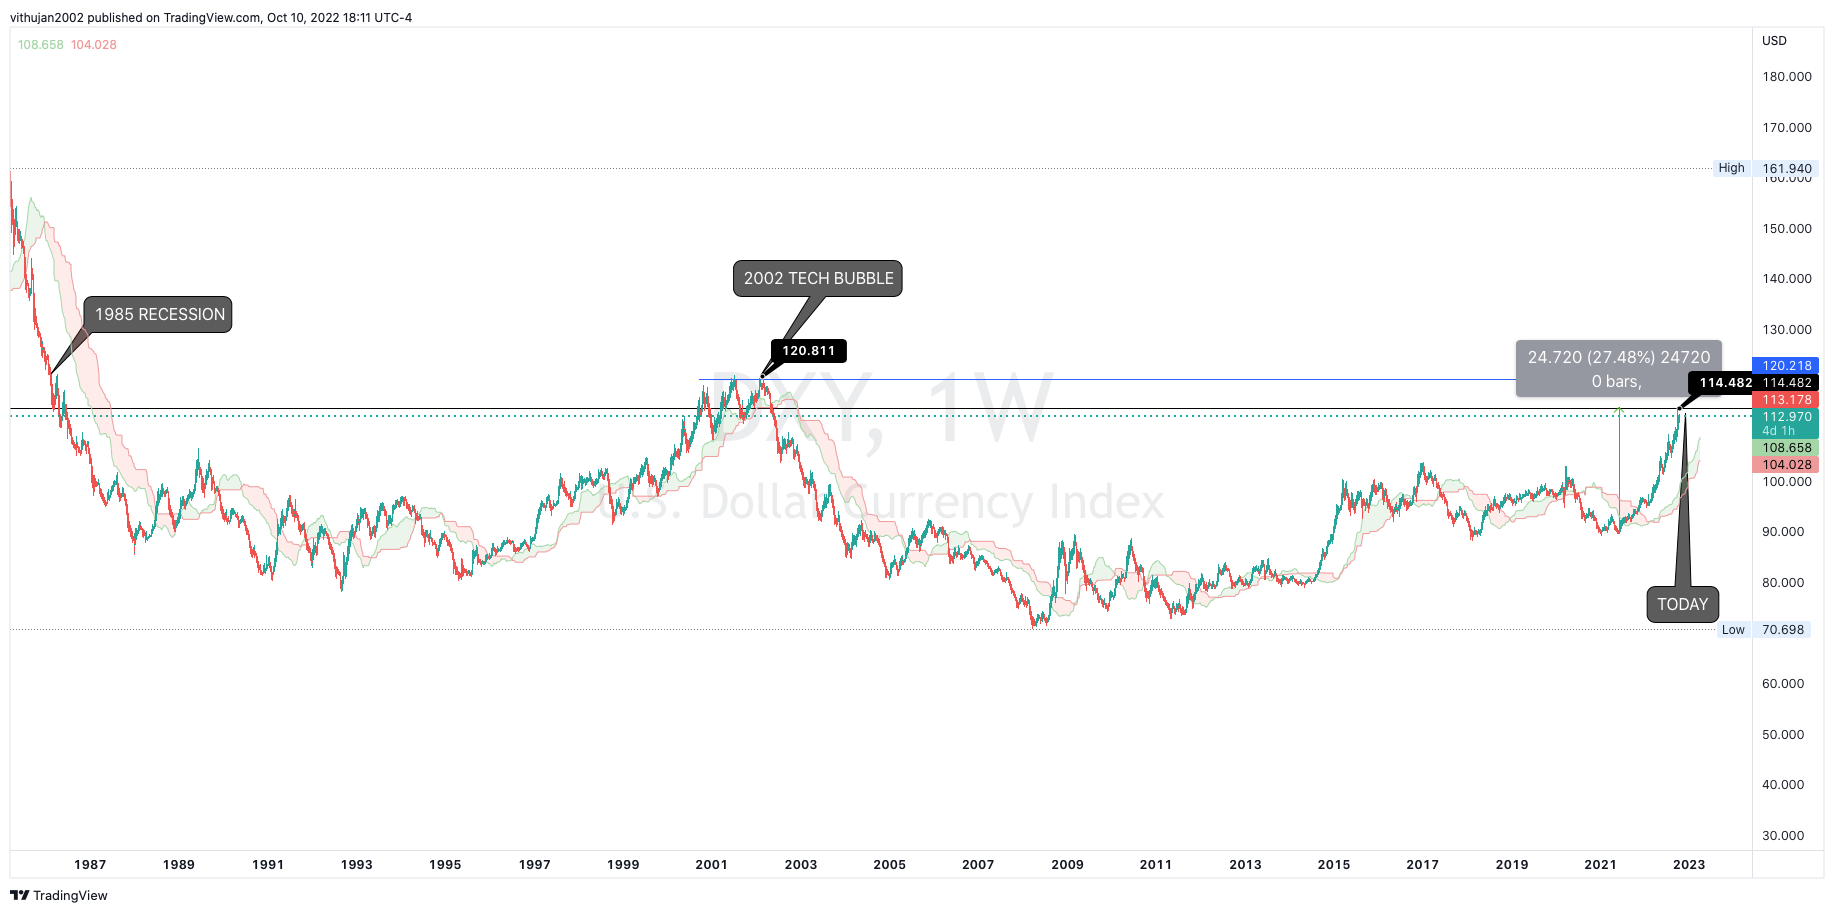
The U.S Dollar has been on an absolute ripper due to many factors I've posted in my private story and will go in-depth in another post with updated data. The dollar is currently at a May 2002 level, at 114.48 with a 27% increase since May 2021. The current level that the dollar is at was after the tech stock bubble burst era which during time the dollar made a high of 120.81. At the current pace of the dollar's growth, 120.81 is a key level to watch because the next break of that level would be a 37-year high during the era of the 1980s recession.